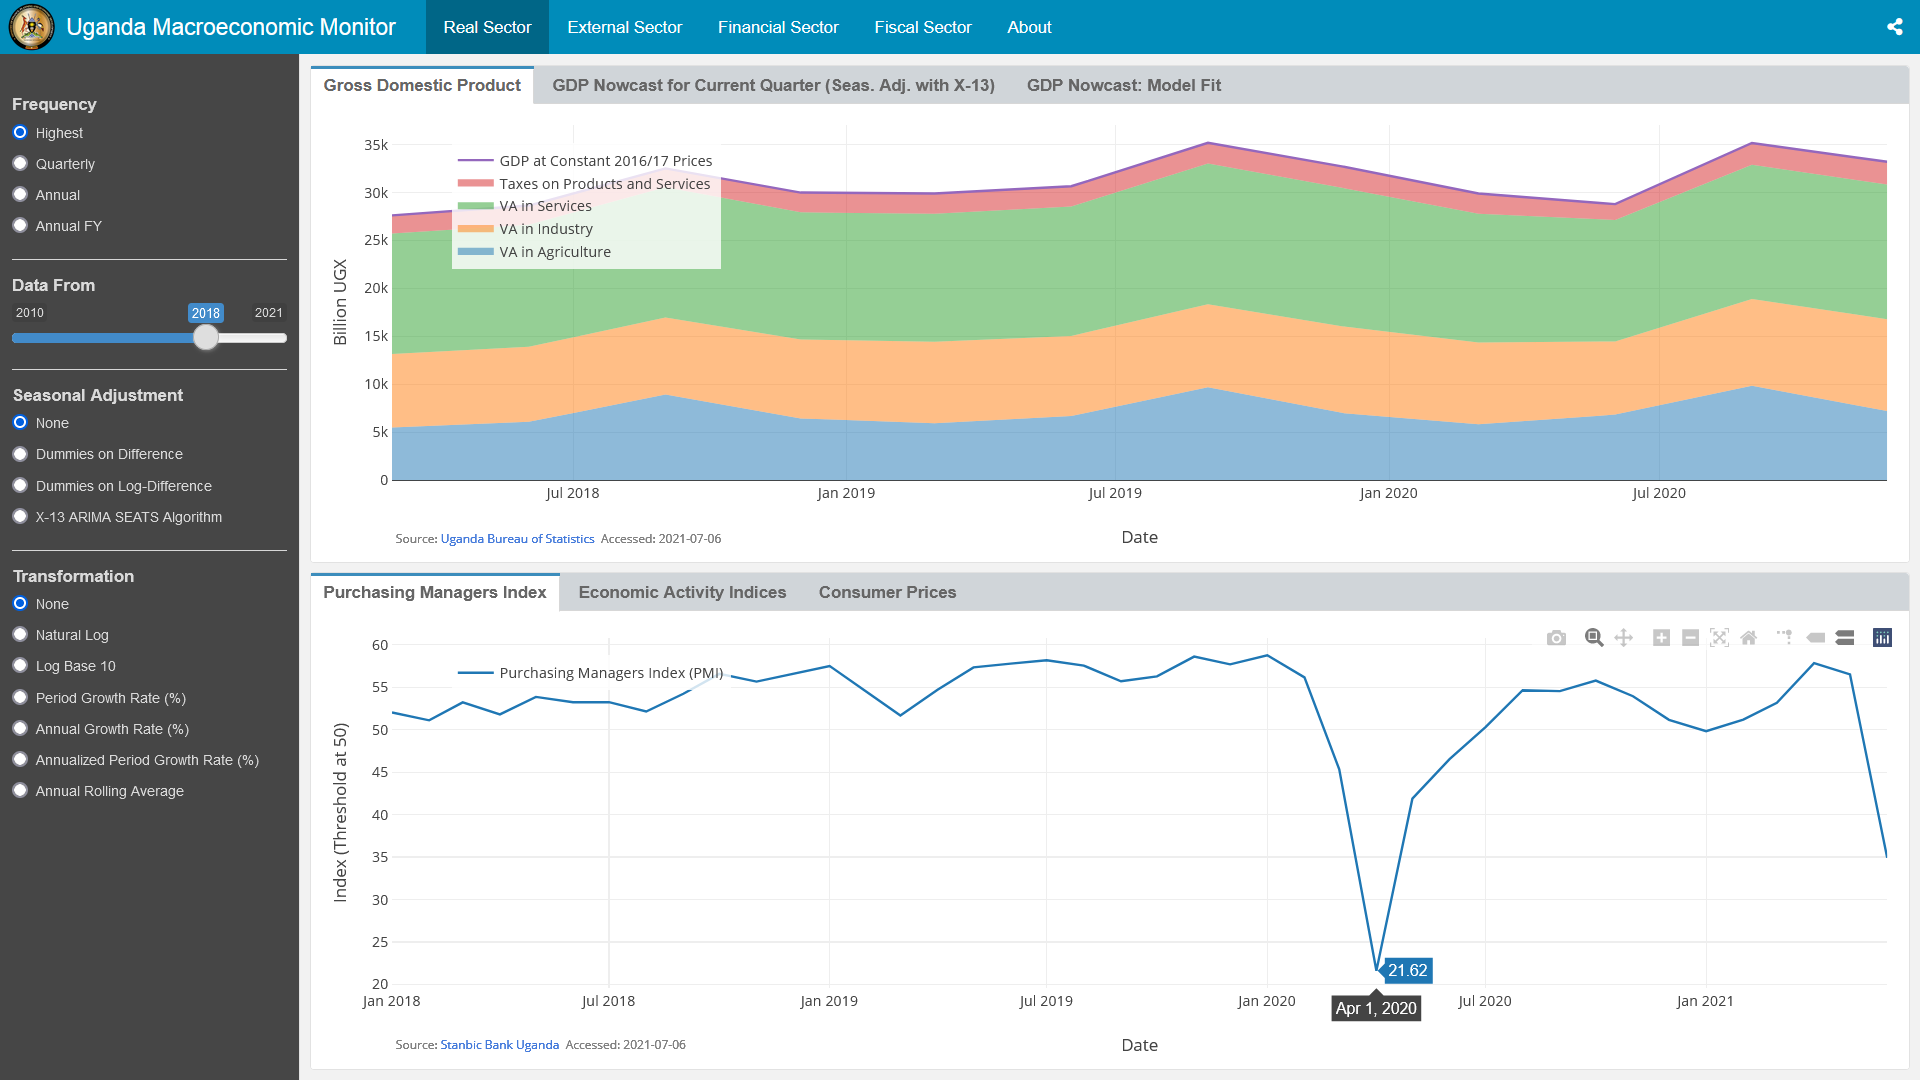
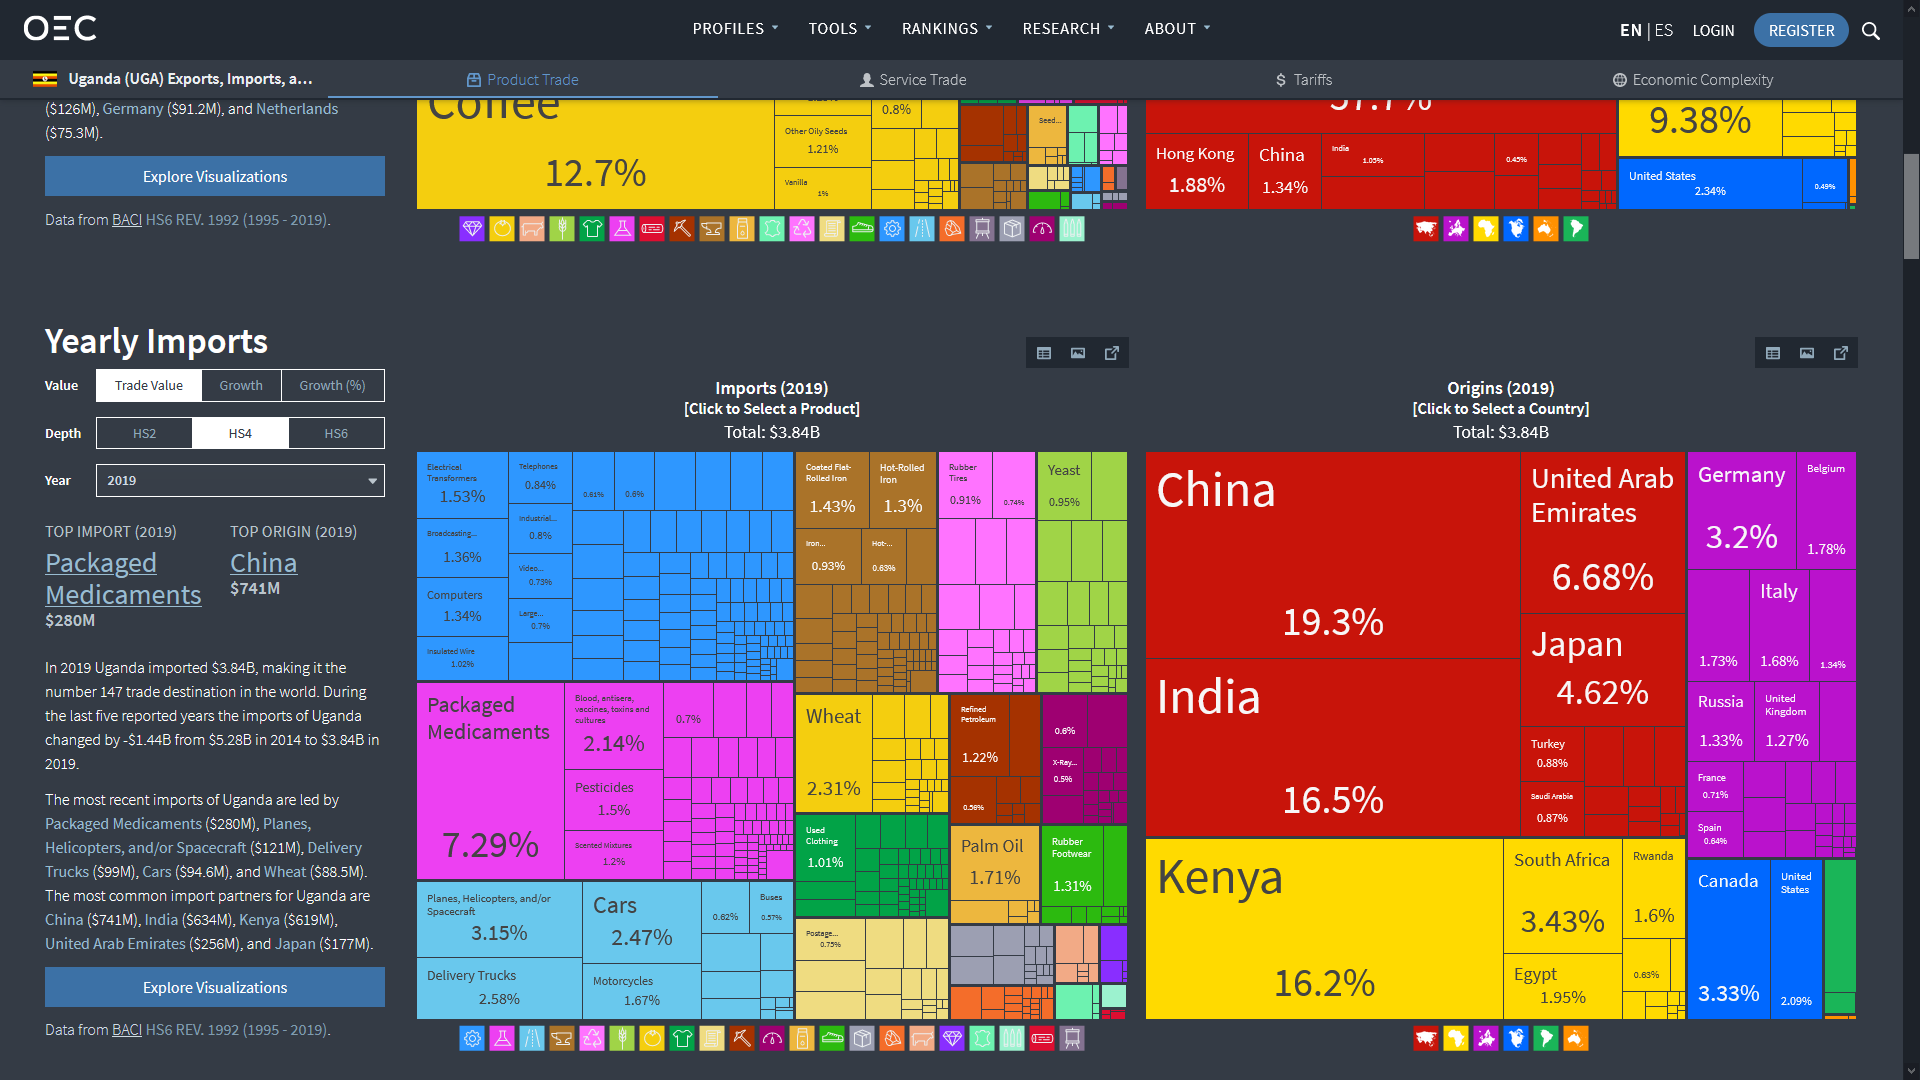
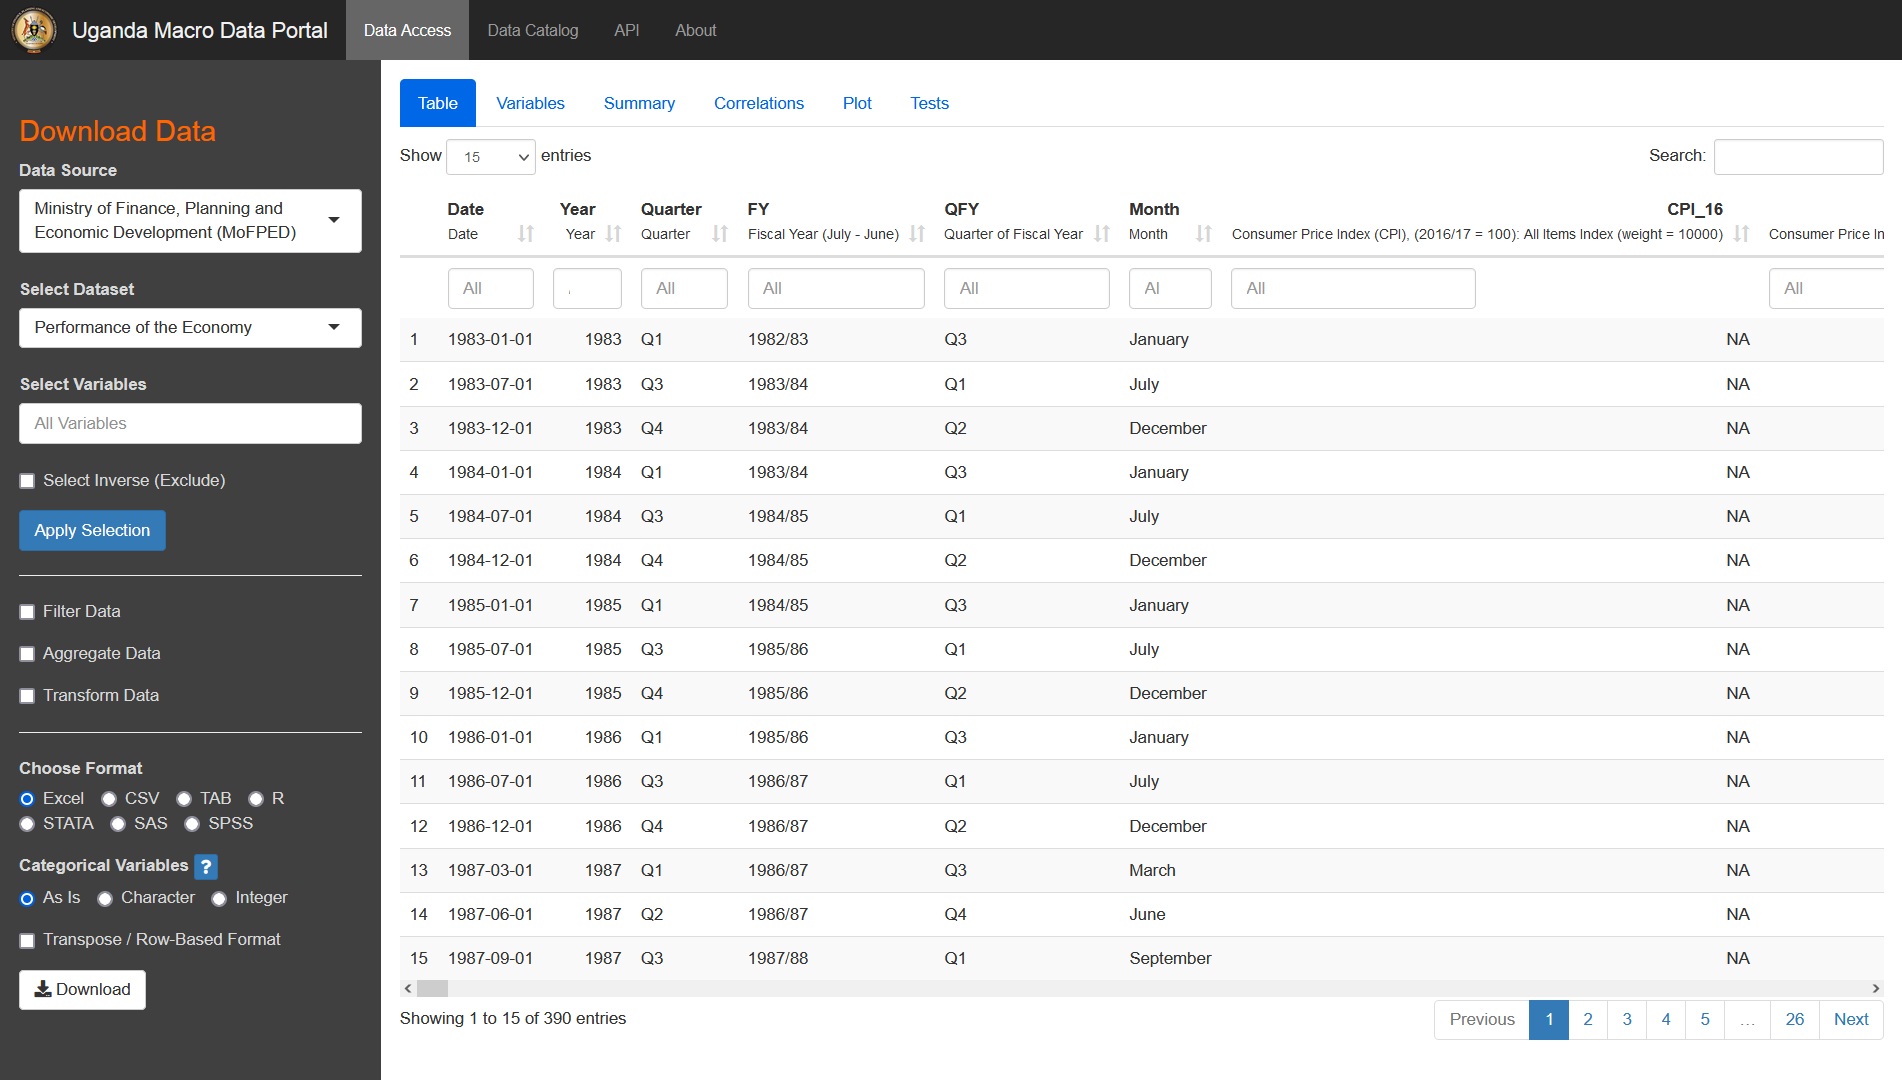
An online data portal providing access to more than 5000 macroeconomic, financial and social time series on Uganda provided by the Bank of Uganda, MoFPED, UBOS, the World Bank, the IMF, the UN-Comtrade Database and the ILO. Data are provided at the highest available frequency (daily, monthly, quarterly or annual) but can be filtered and aggregated in the portal. Data can be downloaded in various standard formats (Excel, CSV, TSV, STATA, R, SPSS and SAS). In addition, an API package is provided for the R statistical programming language, allowing users to easily access tidy macroeconomic time series data in R.

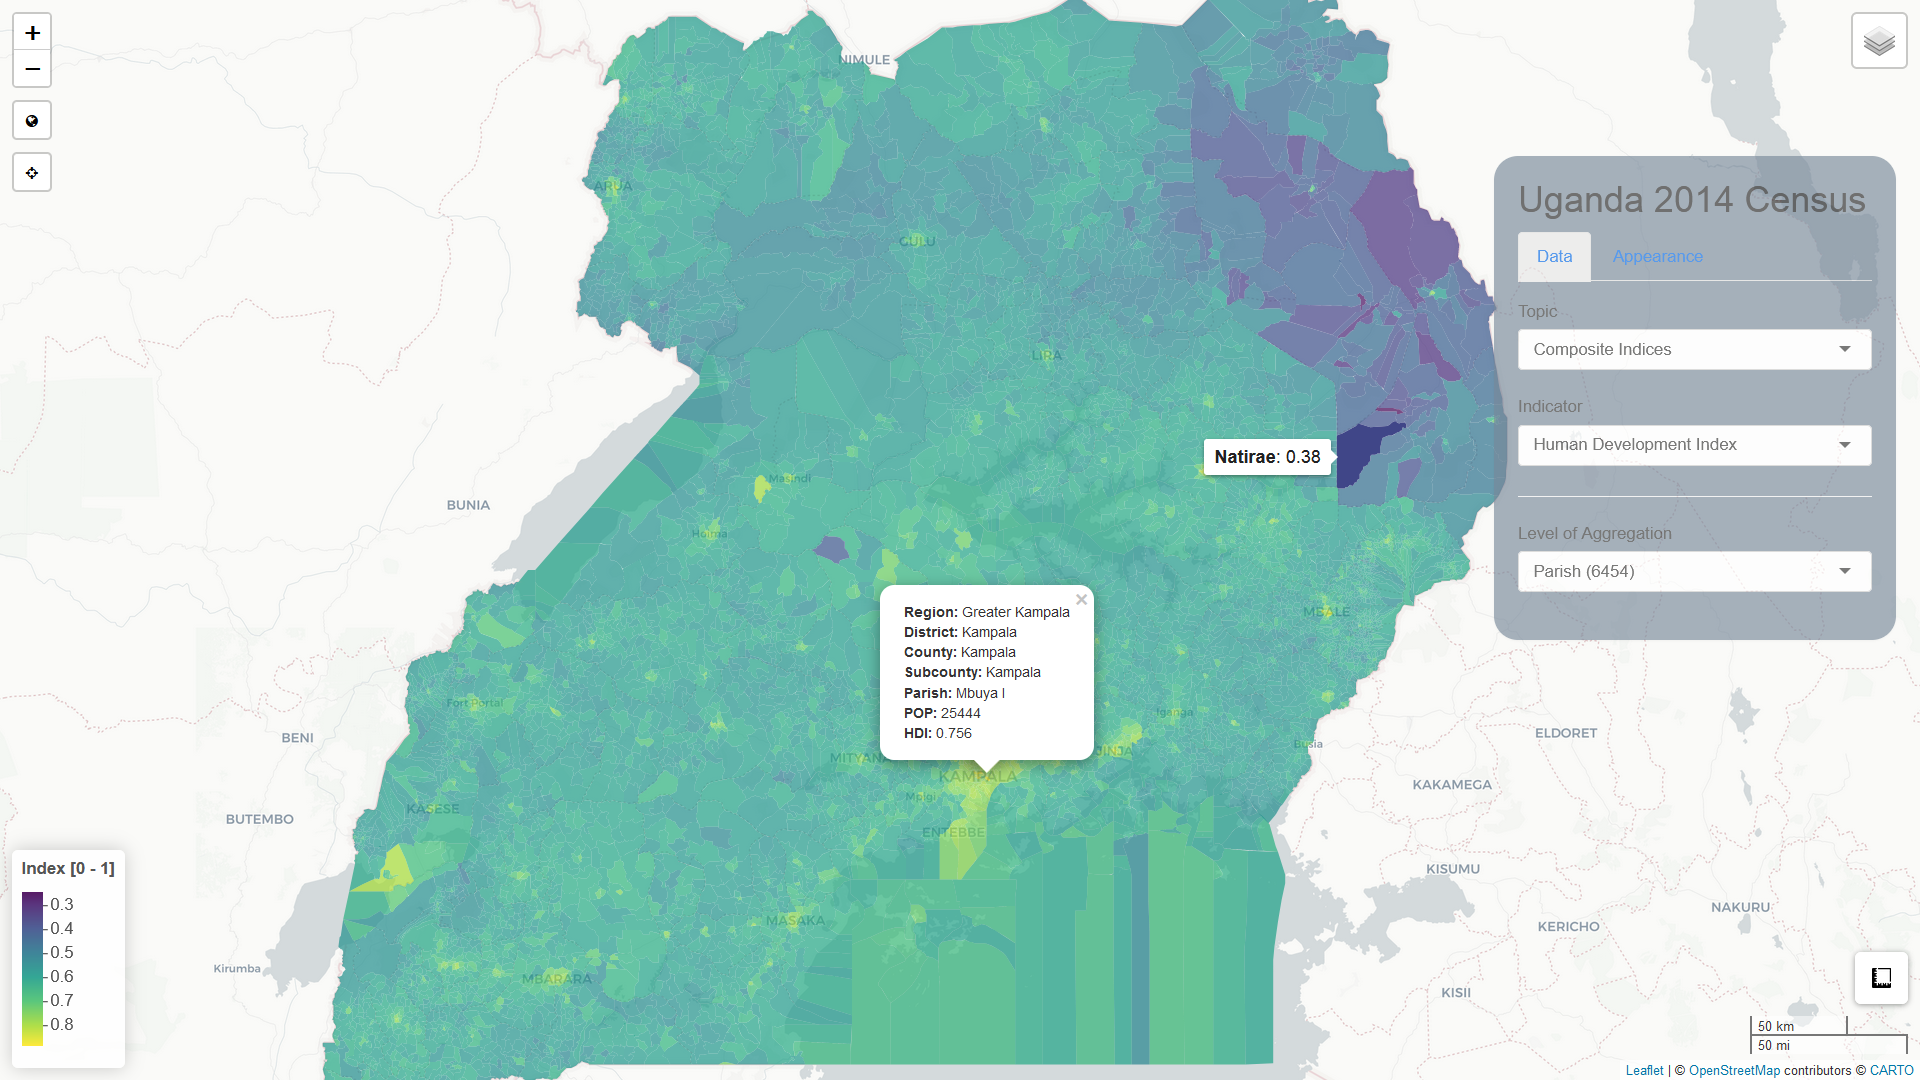
A comprehensive interactive visualization of the 2014 Census, displaying more than 200 census variables at different spatial resolutions, from macro-regions down to the parish level. Additional indices resembling the dimension-indices in the Human Development Index (HDI) are computed from census variables to display a census-HDI. The full census is also available for download in the Macro Data Portal.
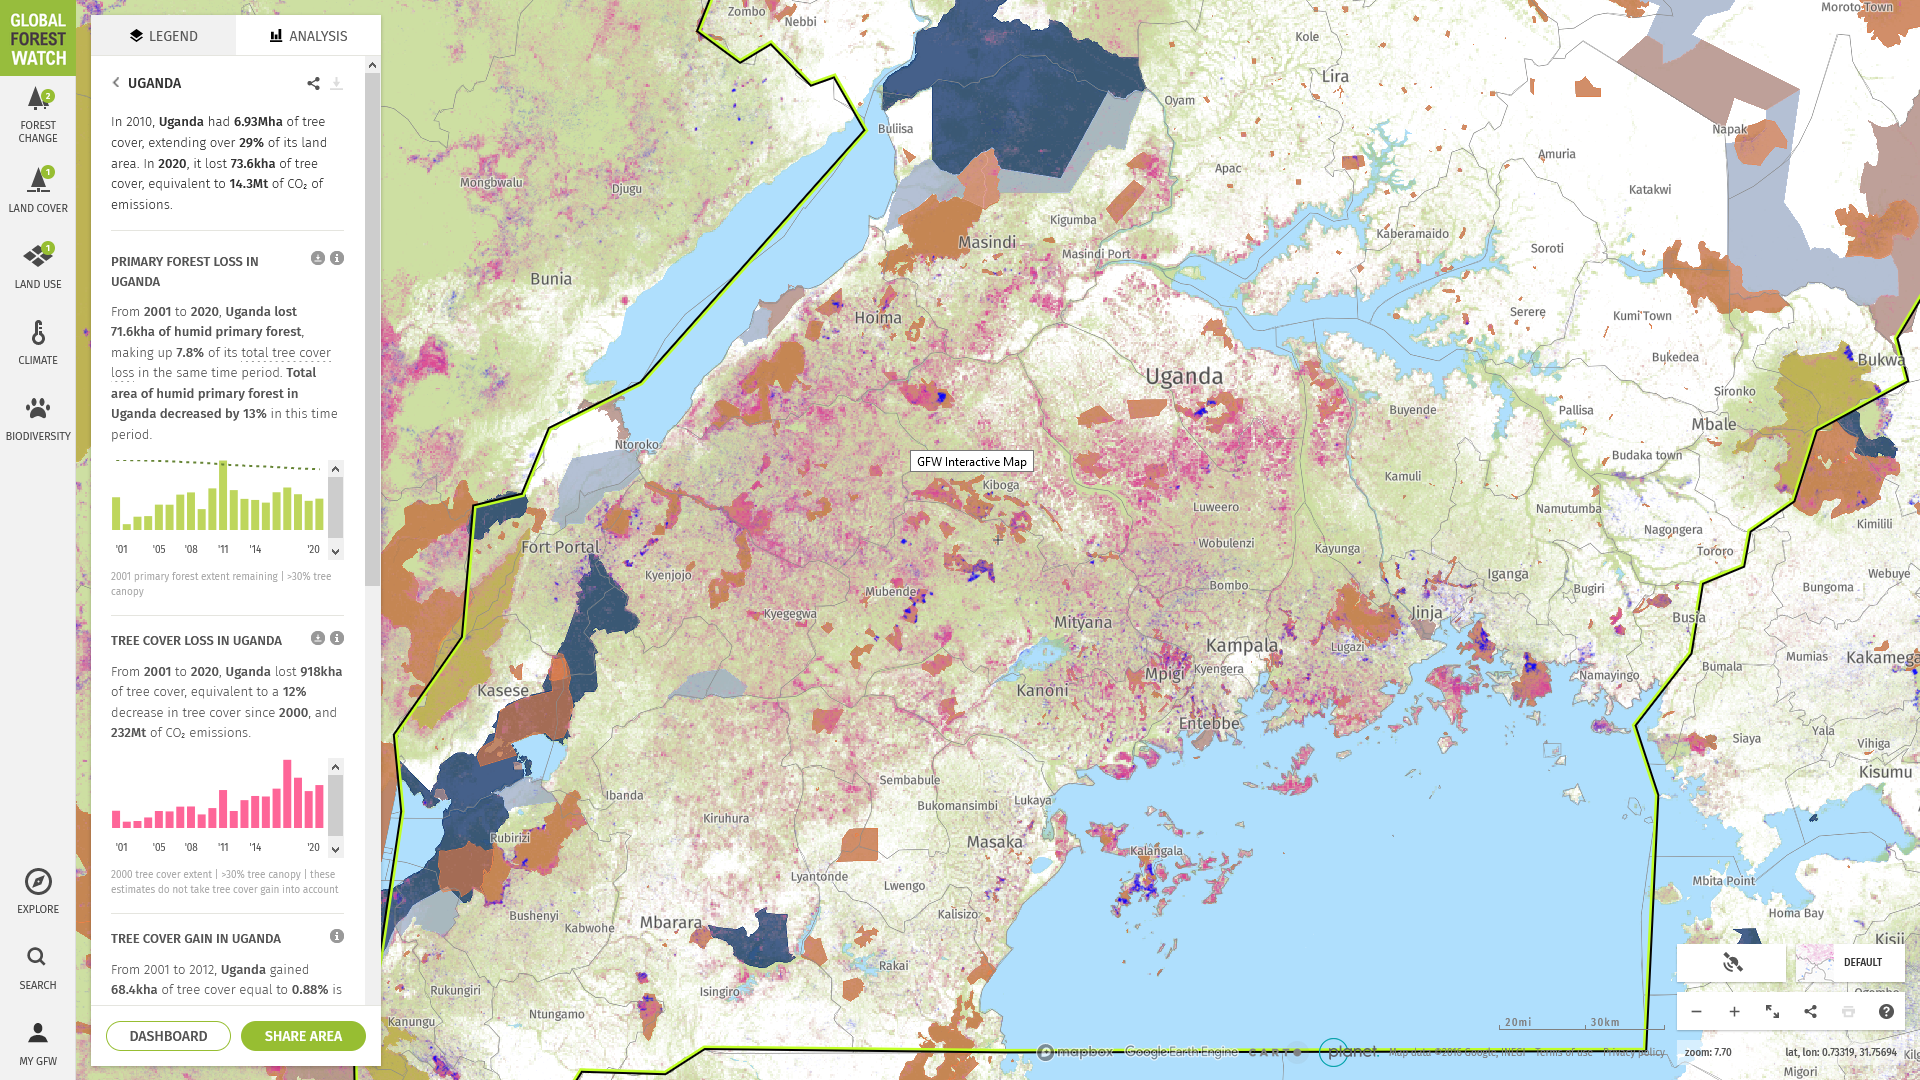
A detailed monitoring tool for deforestation in Uganda based on high-resolution satellite data. By default it shows the treecover in 2000, treecover loss from 2001-2021, and tree cover gain in the period 2001-2012 at 30m spatial resolution, together with current boundaries of protected areas. It can also visualize near real-time RADD forest disturbance alerts (updated every 6-12 days, 10m spatial resolution, cloud penetrating radar images, alternative visualization here), and the slightly less frequent GLAD forest loss alert (updated every 8 days but subject to cloud cover limitations, 30m spatial resolution, alternative visualization here). A dashboard with annual data is also available here.


 MEPD
MEPD
